


Without doubt, the picture of the current market is a complex mix of positives and negatives, partly depending on the time period in question and what is being looked at.
The economy has done better than many had predicted, and consumer confidence has been rising – probably to be further boosted in May with a Coronation bounce. On the 11th May the MPC put up interest rates for the 12th time, raising the bank base rate to 4.5%. This will bring extra pressure to those on variable rate mortgages as well those coming off their current fixed rate. It will impact those entering the housing market for the first time, alongside the 2 million households due to remortgage their fixed rate loans this year, and for whom a sharp rate rise will be felt as a consequence of the rate rises in 2022 and 2023. Given that all these will have cleared previous stress test hurdles, most will cope – but it is still a lot to absorb.
As this suggests, affordability will be a key driver, and households have been seeking to cope with the rising pressures resulting from interest rate and house price rises by taking out long term mortgages, with some two thirds of mortgages now at the “maximum” term of 40 years – up from 50% four years ago.
The expectation is that not only are we near the peak in the interest rate cycle, but that the mortgage market has stabilised, and market competition will give some help to would-be borrowers. The number of mortgage products has increased, and we now have 100% loans available which recognise a renter’s payment record. Indeed, there have even been suggestions that the government might revive the Help to Buy scheme, reflecting the very important place housing issues have in the political landscape.
Mortgage approvals were up in March at 52,000, and at the highest level since October 22. This was above expectations, and although the RICS’ housing market survey results for April were rather mixed, the 12-month outlook had strengthened. This suggests that although the e.surv Acadata survey highlights continuing declines in the rate of price growth, house prices themselves have to a degree stabilised at an England and Wales level (though of course with significant regional and local variations). Once the market has absorbed any interest rate rises, buyers are likely to take a positive view of the medium-term outlook and be less worried about any short-term fluctuations. Spring has arrived, and a degree of increased optimism is becoming apparent.
Richard Sexton, Director at e.surv, comments:
“While many commentators have focussed on the reduction and in some instances falls in house price growth, it’s important to put these into context. Since the pandemic in March 2020, we have seen house prices rise by £60,000 or 20% and the subsequent reduction of just under £5000 from the peak in October 2022 is a good place from which to do this.
“Now more than ever, we should remind ourselves that monthly trends, often sparked by non-housing economic trends, do not change some fundamentals about the market.
“The ongoing lack of supply and current affordability issues are stymying activity but also support prices in part because there simply is not enough of the right kind of housing in the market. The extent to which this is the case has been the acknowledgement by both main political parties this month that housing will be a key election issue. We have heard already about the mooted return of Help-to-Buy and other market led mortgage products to support new buyers.
“We are only just past April – a key month for buyers and sellers and it is too early to say whether this key month in the housing calendar will herald a return to more normal growth trajectory. But whatever the next couple of months bring, our data suggests undue levels of pessimism are probably misplaced.”
Table 1. Average House Prices in England and Wales for the period April 2022 – April 2023
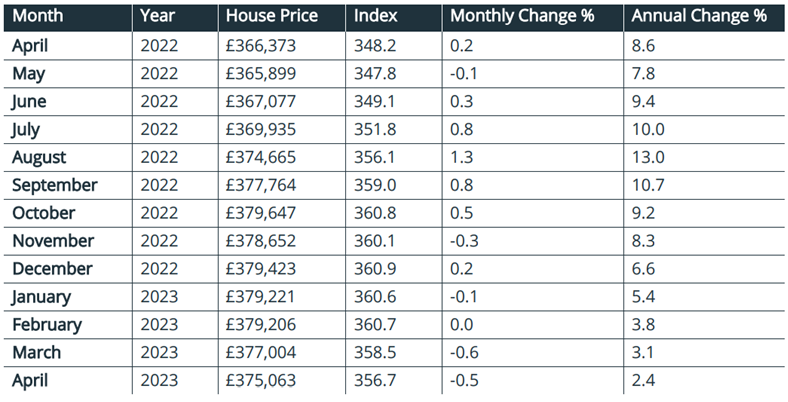 Note: The e.surv Acadata House Price Index provides the “average of all prices paid for domestic properties”, including those purchases made with cash.
Commentary: John Tindale and Peter Williams, Acadata Senior Analysts
Figure 1. The average house price growth in England and Wales, April 2021 – April 2023
 On an annual basis, the average sale price of completed home transactions in England and Wales in April 2023 rose by some £8,700, or 2.4%. This is the lowest rate of annual increase since June 2020, and is the eighth month in succession in which the annual rate has fallen. On a monthly basis, the average price fell in April 2023 by around £1,940, or -0.5%. April is a key month in the transactions calendar, with buyers as well as sellers active in the market. Here we see that, despite this, both annual and monthly rates show evidence of continuing reductions in price growth.
However, as Figure 1 illustrates in terms of actual nominal prices, the fall in price in April 2023 is relatively minor, especially when compared to the cumulative £43,360 rise in prices since August 2021. In fact, prices have risen by some £60,000, or 19%, since the start of the pandemic in March 2020, compared to a fall of some £4,600 from the peak price achieved in October 2022, at £379,647 – so some perspective is required in determining the extent of the current price falls.
Average Annual Regional House Prices
Figure 2. The annual change in the average house price for the three months from February to April 2023, analysed by GOR
 Figure 2 shows the percentage change in annual house prices on a regional basis in England and for Wales, averaged over the three-month period of February to April 2023, compared to the same three months in 2022. These figures are produced on a rolling three-month basis to smooth out minor changes in price which may arise, and are centred on March 2023 (pink line), with Figure 2 also showing the similarly-averaged figures for February 2023, one month earlier (blue line). The Acadata prices are also adjusted for seasonal variation.
As can be seen, the changes in average house prices over the last twelve months remain positive in nine of the ten GOR areas, with Greater London being the only area where prices have fallen over the period. However, all ten regions now have a rate of growth of 6.0% or less – just three months earlier, in December 2022, the highest regional rate was nearly double this at 11.0%.
Since last month, the rate of growth of house prices has fallen in eight of the ten areas, with only the North East and Greater London seeing higher growth this month (March) compared to last. The largest fall was in the West Midlands, down by 1.8% from 7.8% to 6.0%, followed by the North West, down 1.3% from 4.1% to 2.8%.
Despite having the biggest fall in prices, the West Midlands remains the top region for the third month running in terms of the rate of price growth, at 6.0%. This month Herefordshire, Warwickshire and the West Midlands unitary authority (which includes Birmingham) have been the region’s top performers, with annual price growth of 11.8%, 8.9% and 6.8% respectively.
Wales, with 5.3% growth, is in second place this month, having pushed the South West region into third position. In Wales, there are three local authority areas, all in South Wales, with price growth in excess of 10%, these being the Vale of Glamorgan (19.0%), Newport (11.6%) and Bridgend (10.1%).
As already noted, Greater London is the only GOR area with negative growth, at -1.9%, although this was actually 0.2% higher than the -2.1% seen in the previous month. In March 2023, 17 of the 33 London boroughs saw prices rise on an annual basis (four fewer than the previous month). Broadly, it continues to be the most expensive inner areas that are recording falling prices – impacting eight of the top ten boroughs ranked by price. For example, in the City of Westminster – which is ranked in second place in London in terms of its average value – house prices have fallen by -33.2% over the last twelve months, while in Kensington and Chelsea – the most expensive borough in London – prices fell by -17.1%. Meanwhile, 12 of the 16 lowest-priced London boroughs have seen their prices rise over the last twelve months, the four exceptions being Tower Hamlets (-15.9%), Newham (-3.6%), Enfield (-3.1%) and Bromley (-1.2%). Tower Hamlets has the second-highest proportion of flat sales of the 33 boroughs in Greater London, at 93%.
England and Wales Regional Heat Map
These different trends are then evident in the Regional Heat Map shown below for March 2023.
There are perhaps three groups in England and Wales in March 2023 in terms of house price growth. First are five areas with price growth of 4.8% or higher, being the East and West Midlands, Wales, Yorkshire and the Humber and the South West. There then follow four regions where price growth lies between 2.8% and 4.0%, which are the two areas surrounding Greater London, the East of England and the South East, to which we can add the North East and the North West. Finally, there is Greater London on its own, with prices falling on an annual basis by -1.9%.
 Annual Growth Rate
The annual growth rate in England and Wales in April 2023, for both mortgage and cash-based house purchases, was an arithmetic average of 2.4%. This is 0.7% below the revised rate of 3.1% in March 2023, and represents the eighth month in succession in which the annual rate of house price growth has slowed. It is however the smallest reduction in these eight months, perhaps suggesting a slowing in the rate at which house prices are falling.
In March 2023, 102 of the 110 Unitary Authority areas in England and Wales were still recording house price gains over the last twelve months, indicating the wide extent of price rises that had taken place across the two countries, even if the growth rate is now diminishing. It is notable that there are only eight areas with price falls outside of Greater London, where 16 of the 33 boroughs in March were seeing declining prices over the year.
The eight areas in England and Wales which failed to record a price increase over the year were, from North to South, County Durham (-1.7%), Cumbria (-0.1%), Blackpool (-4.0%), Flintshire (-1.1%), Gwynedd (-8.0%), Rutland (-2.7%), Buckinghamshire (-1.6%) and Bracknell Forest (-6.0%). The rather alarming fall in prices of -8.0% in Gwynedd is caused by the purchase of a £2 million detached home in Abersoch in March 2022 – this sale was not repeated in 2023, and caused average prices to fall. The average price of a detached property in Gwynedd in 2023 is closer to £325k.
The area with the highest annual increase in prices in March 2023 is the Vale of Glamorgan, at 19.0% growth – the average price of both detached and semi-detached homes in the Vale having increased by some £100k over the last twelve months, to £575k and £405k respectively. The increase in the average price of detached homes in the Vale was assisted in the month by the sale of a £2.6 million five-bedroomed property in Penarth. Penarth is located some three miles to the south of Cardiff on the Severn Estuary coast – it is known locally as “The Garden by the Sea” due to its large number of parks and open spaces – which ticks the new hybrid requirements of having both space as well as an easy commute to the office. We might also highlight the divergence across Wales, with the market’s performance in the Vale contrasting sharply with that in Gwynedd in North Wales.
Monthly Change
Average house prices fell by £1,940, or -0.5%, in April 2023 – this fall was only £260 less than the fall in March, but the two months together represent the largest decrease since April 2021– the month after the SDLT tax holiday in England and the LTT tax holiday in Wales were originally due to be withdrawn. In fact, the LTT holiday in Wales was extended to June 2021, and the SDLT holiday was extended to September 2021 in England, although at lower rates from 1 July 2021 onward.
In March 2023, prices rose on a monthly basis in 37 of the 110 Unitary Authorities, which is 20 fewer than in February, continuing the trend established over the previous month of a decline in the number of authorities where prices are rising. The area with the greatest increase in prices in March was the Isle of Anglesey, up by 5.1% in the month. Detached properties on the Island had the highest increase in in the month, assisted by the purchase of a three-bedroomed bungalow, with stunning views over the Menai Strait, for £600k. The second-placed authority in terms of price growth over the month is the Vale of Glamorgan, also with a 5.1% price increase, as described above. In third place is Windsor and Maidenhead, up by 4.7%, where the purchase of a £6.4 million five-bedroom detached home, on the riverside in Bray, helped to enhance prices. Maidenhead, which is close to Bray, has a 20-minute train service into Paddington, which adds to the desirability of living in the area.
The North East was the only GOR area in England and Wales which saw prices increase during March 2023, compared to seven GOR areas with price rises in February. In the North East, the areas with the highest increase in prices in the month were Hartlepool (+3.5%), Northumberland (+3.2%) and Darlington (+2.2%). These increases were sufficient to provide the North East region with a new record average price, of £202,451.
Comparison of Indices
Figure 3. The annual change in house prices April 2022 – April 2023
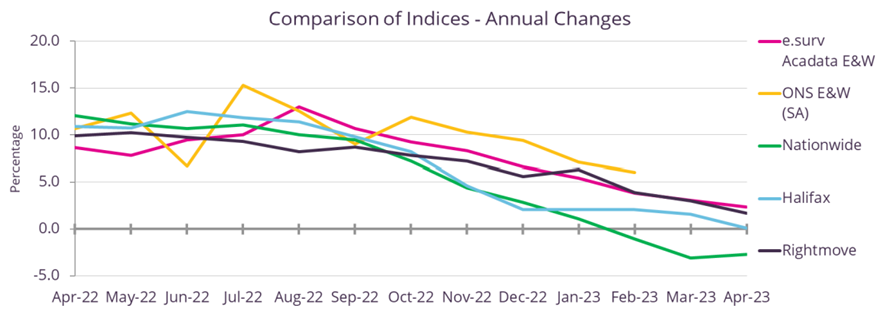 Figure 3 illustrates the annual rate of change in house prices as measured by the five different index providers listed in the legend to the right of the graph, for the period April 2022 to April 2023. In general, the indices agree that the rate of growth has been slowing over time, although there is a difference in opinion as to exactly when the upward movement in prices reached its peak, and the speed of its subsequent descent.
The range in the rates of growth was at a minimum in September 2022, at just 2.0%, with e.surv Acadata reporting 10.7%, while Rightmove was indicating 8.7%. Following the September figures, it can be seen that, with one or two notable exceptions, the general direction of all five indices has been downward, but at different speeds.
The two lender indices – Halifax and Nationwide – had shown remarkably similar growth rates from September until January, with Nationwide being the first to announce, in February 2023, that on an annual basis house prices had turned negative. Halifax came close to following suit this April, showing a positive annual rate of growth of just 0.1% over the year.
The Rightmove and e.surv Acadata’s rates have been converging, with both indices suggesting that prices still remain higher than twelve months earlier, although the gap between this year’s and last year’s prices is narrowing. Meanwhile, the ONS index is showing more volatility than the other four, possibly due to its policy of not smoothing (averaging) its results over time. However, it too is reporting a similar slope to e.surv/Acadata and Rightmove since October 2022.
There are three main reasons why these price indices differ from each other. The first is to do with the timing of obtaining the price data in the home purchase timeline. Rightmove is the earliest, since it measures its data at the point when a seller first places the property on the market. It is an asking price, and depending upon the state of the market, negotiations will follow – up or down reflecting local demand. The two lender indices base their data on prices being notified as the application for a loan reaches the mortgage approval stage. Finally, e.surv Acadata and the ONS both use Land Registry data, which dates the sale at the time of contract completion. This is the final sales price.
The second difference is that the ONS, Rightmove and e.surv Acadata will be recording both cash and mortgage-based purchases while, by definition, the lenders only record the prices on their own loan-based transactions. Finally, e.surv Acadata and the ONS use all the domestic transactions recorded at the Land Registry, while the lender indices may well have policies in place, such as not lending on homes with a price in excess of £X million, which could introduce a slight bias into their results.
Each has its own merits, but it is useful to understand the differences in order to better appreciate what the indices are showing and why they differ. In addition – given the divergence between Halifax and Nationwide this month – the differential make-up of the loan portfolio being processed at this time is reflected, with the average price of a Nationwide loan being around £30,000 lower than its rival.
Housing transactions per month
Figure 4. The total number of housing transactions per month, January 2007 – March 2023
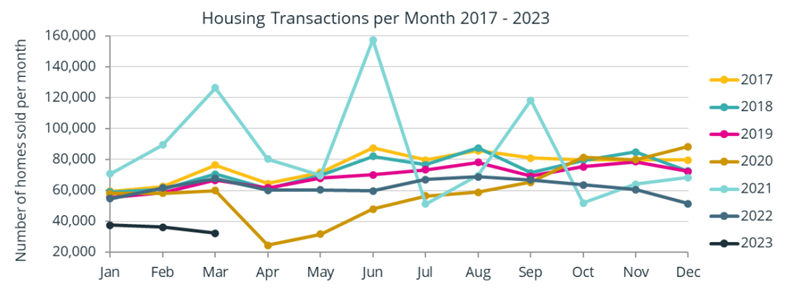 Figure 4 shows the total number of domestic property transactions per month recorded at the Land Registry for England and Wales, covering the period from January 2017 to March 2023.
There are four years of particular interest in Figure 4. The first is the light brown line of 2020. This year started with an average 58,640 transactions in the first three months, up to the start of the pandemic, which was announced during the later part of March 2020, when households were instructed to remain at home (if not employed in an essential service). The announcement came too late to affect March sales, but in April 2020, the number of property transactions slumped to 24,560. Although property sales slowly increased during the remainder of 2020, the recovery was prolonged.
During 2021, the light blue line, the housing market was transformed, in part due to the tax-holidays that were made available in both England and Wales, and in part owing to the change in attitude brought about by working from home coupled with the desire for more space. Three spikes are clearly visible in March, June and September 2021, which were all tax-holiday related.
By contrast 2022, the grey line, proved to be a far more subdued and stable year than 2021, with transactions returning to an average 62,000 sales per month – slightly ahead of the levels seen in 2020. The reduction in sales from September 2022 onward is visible, coinciding with both the arrival of Mrs Truss as Prime Minister on 6 September 2022 and the sixth increase in the official bank rate, to 2.25%, on 22 September 2022. Liz Truss departed as Prime Minister on 25 October 2022. The bank rate was further increased on 3 November and 15 December 2022, ending the year at 3.5%. Housing sales in December 2022 totalled 51,410 – the lowest December total on the graph.
2023, the black line, has only seen an average of 35,000 sales per month – the lowest level of these three months since the banking crisis of 2009 – but the data for these months is still emerging, so these totals will slowly increase over time.
Property types
Figure 5. The annual change in house price growth in England and Wales, for the period from January 2020 to March 2023 by Property Type
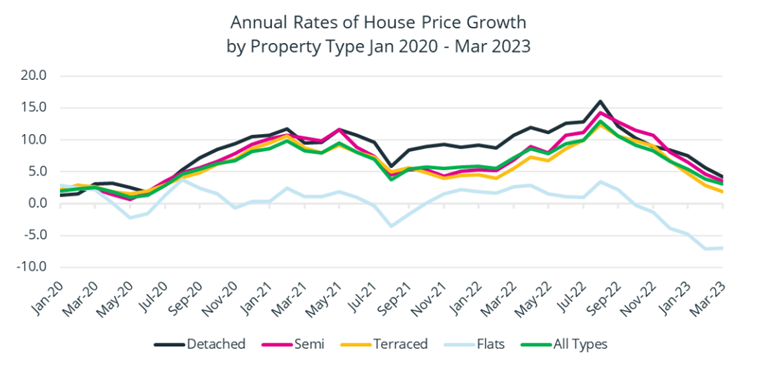 Figure 5 above shows the different movement in average house prices from before the start of the pandemic in March 2020 to March 2023.
As can be seen, detached properties had the highest rate of price growth over the majority of this period, with semi-detached and terraced properties both having lower rates, broadly similar to each other. Also clear are the far lower rates of price growth – frequently negative – associated with flats over this same period.
The high rate of price growth for detached properties is perhaps not too surprising. As has been well documented, the pandemic resulted in life-style changes relating to the purchase of homes, with many buyers seeking out larger properties to enable them to “work from home” – which colloquially became known as the “Race for Space”. Additionally, other buyers sought out second homes in areas of natural beauty and coastal locations, to enable them to take “staycations”, or to establish “holiday lets”, as foreign travel became largely prohibited. The resultant competition for these larger properties drove up prices.
Flats over this period were subject to two separate factors. Firstly, there was the corollary of the “Race for Space”, in that flats rarely have their own private gardens and were less likely to have an extra room which could be converted into an office. Consequently, there was a general tendency for those looking to purchase a property to move up the housing chain in terms of usable floor area, which reduced the demand for flatted homes. At the same time, following the cladding crisis associated with the aftermath of the Grenfell Tower fire, lenders required an EWS1 certificate to ensure the flat was “fit for purpose”. In many cases these certificates proved hard to obtain, which similarly reduced demand for flatted properties. Hence the price of flats slipped further behind other property types.
There has been recent discussion that returning to the office is now becoming the norm for many employees, at least on a 3-day per week basis. This has been accompanied by a movement back to the suburbs of many cities and perhaps “pieds-à-terre” in Central and Inner London (not least given the fall in prices there), to cut down on commuting time and associated costs.
However, looking at the price trends in Figure 5, there does not appear to be any clear overall winner in terms of property types, as was the case with detached properties in much of 2021 and 2022 – although there is a slight uptick in flats in March 2023 – a trend we will closely monitor – although flats are currently losing value at a rate of -7.0% per annum.